The following demos were produced by students working with us for their semester projects. We routinely show these to the EPFL administration, such as the vice-president for education. If you’d like to see your project on this list, check out our list of proposed student projects, and get in touch with us!
Graph-Based Course Navigator
[works best in Chrome browser]
Authors: Raphaël Steinmann, Maxime Coriou
Supervisors: Dr. Francisco Pinto, Dr. Patrick Jermann
Description: This webapp is a result of 2 student projects, and represents the entire EPFL course catalog in a graph format. The nodes represent courses, the edges represent pre-requisites. The type of edge line (solid or dashed) indicates the level of confidence in the connection. If the line is solid, it means the pre-requisite was explicitly mentioned in the course description. If the line is dashed, it means the pre-requisite was estimated by a NLP (natural language processing) algorithm.
Skills developed: Data mining, natural language processing (NLTK), graph databases (Neo4J), JavaScript visualisation (D3, Sigma.js).
Swiss Job Market Skills Graph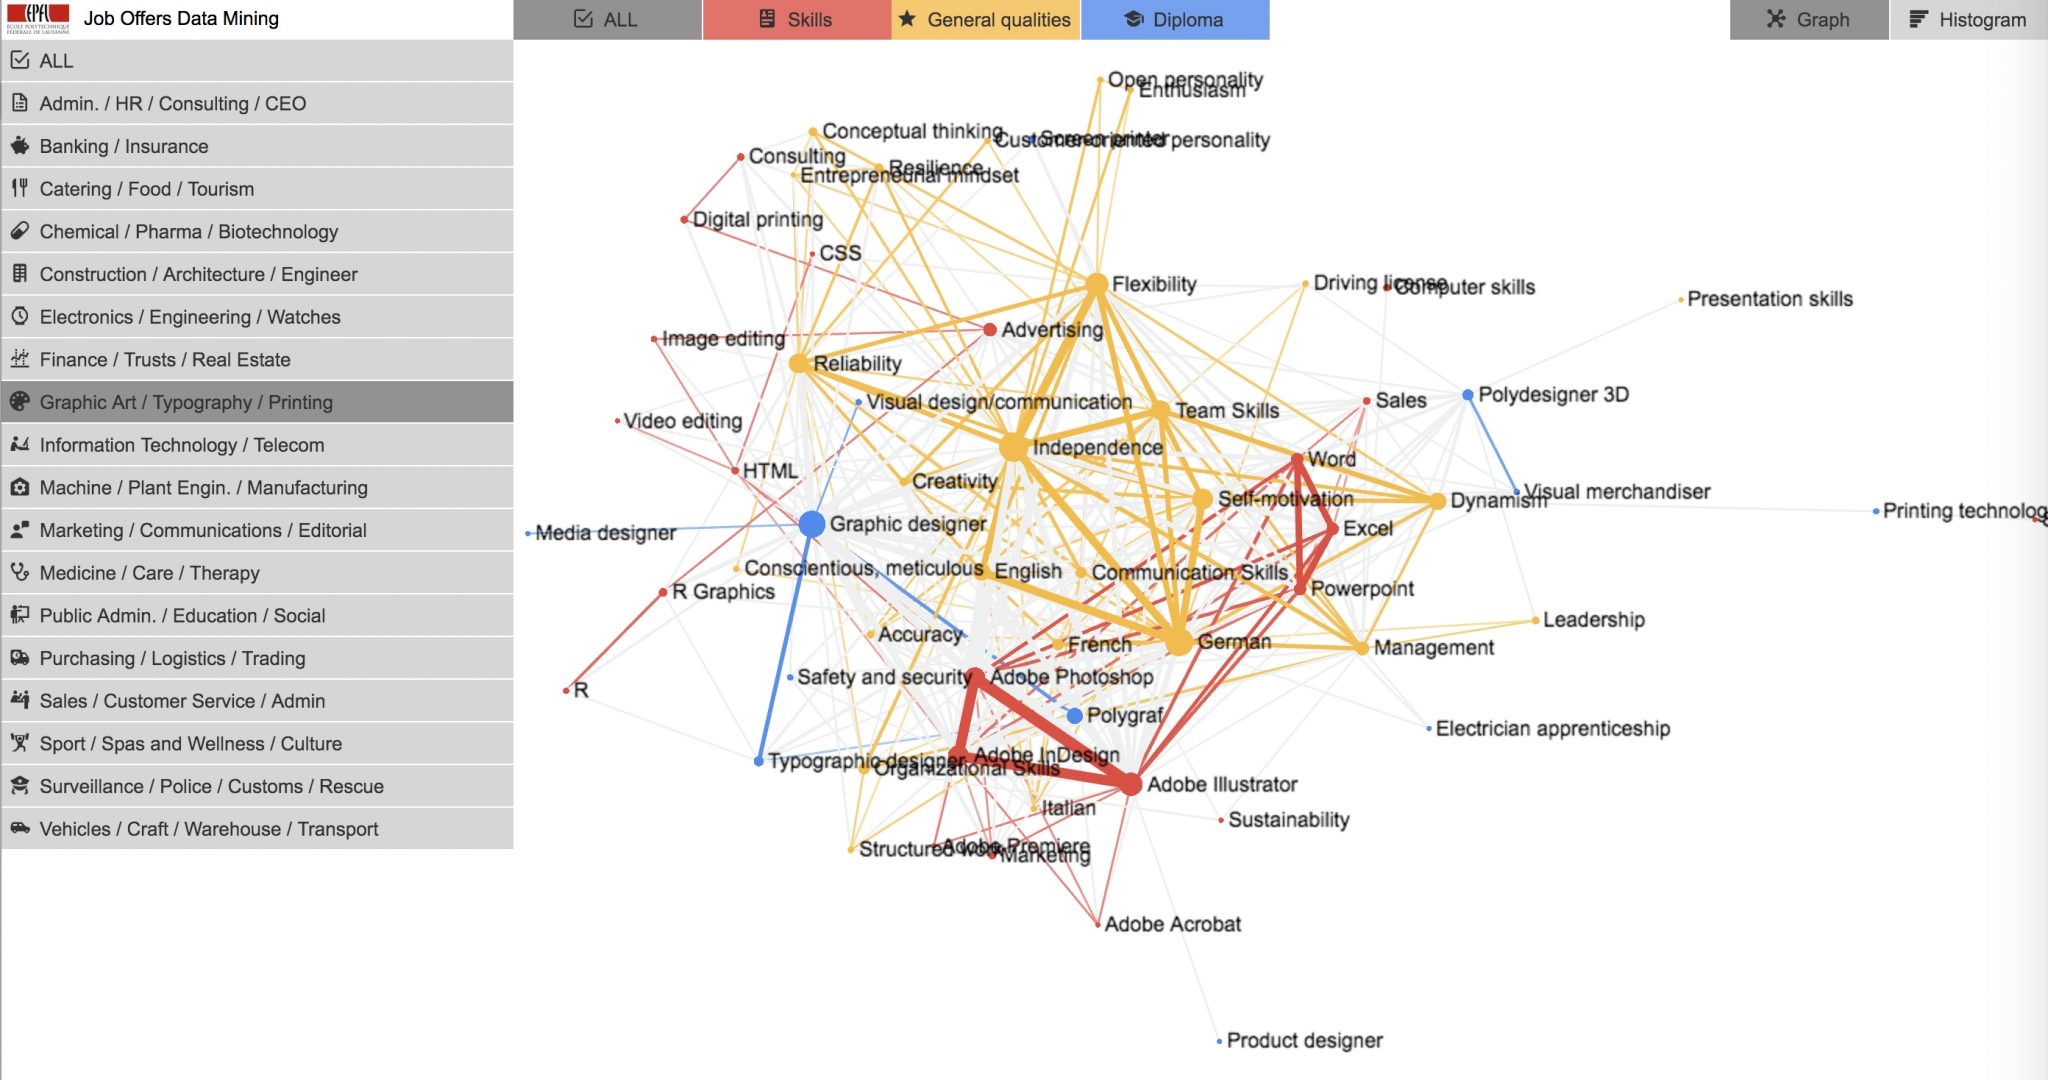
Authors: Matteo Giorla
Supervisors: Dr. Francisco Pinto, Dr. Patrick Jermann
Description: This webapp shows a snapshot of the Swiss job market in early 2017. The graph shows the hard and soft skills extracted from 20’000+ job offers, using data mining and natural language processing algorithms. The size of a node represents how many job offers refer to a skill; the thickness of the edge represents how many times 2 skills show up together.
Skills developed: Data mining, natural language processing, JavaScript visualisation (Sigma.js).
MOOC Forum Interactions Map
Authors: Emma Lejal-Glaude
Supervisors: Dr. Francisco Pinto, Dr. Patrick Jermann
Description: Our MOOCs are used by thousands of users every day, a small percentage of which go to the forum to help each other out. This JavaScript visualisation shows the exchange of messages and comments between MOOC users over a 24h period, with the timezones represented by the bright and dark regions in the map. The source and destination city of each message is determined by the IP address of the user.
Skills developed: JavaScript coding and visualisation packages.

Figure: Prof. Marcel Salathé showing the student’s demo to the
President of the Swiss Confederation, Ms. Doris Leuthard.
[Source: EPFL President’s tweet]
MOOC Video Navigation Flow
Authors: Frédéric Moret
Supervisors: Dr. Francisco Pinto, Dr. Patrick Jermann
Description: One of the advantages of having a course in MOOC format is that a professor can visualise how students navigate the different parts of a video lecture. This demo shows the video navigation patterns of students who took our Computational Neuroscience MOOC. The blue curves show the flow of students navigating out from a slide; the green curves show the flow of students navigating into a slide.
Skills developed: MySQL databases, Python notebooks, JavaScript visualisation.
MOOC Learning Strategies Flow
Authors: Yumeng Hou
Supervisors: Dr. Francisco Pinto, Dr. Patrick Jermann
Description: Users who take our MOOCs have different ways of learning that they adopt from one week to the next. They can focus on watching the newest videos, revising old videos, solving exercises, or using the forum. By modelling these learning strategies as a state machine, we can determine a path that students followed from beginning to end.
Skills developed: Markov chains, JavaScript visualisation.