Please note that the publication lists from Infoscience integrated into the EPFL website, lab or people pages are frozen following the launch of the new version of platform. The owners of these pages are invited to recreate their publication list from Infoscience. For any assistance, please consult the Infoscience help or contact support.
A Large-Scale Multi-Lingual Color Thesaurus
We present a color thesaurus with over 9000 color names in ten different languages. Instead of using conventional psychophysical experiments, we use a statistical framework that is based on search results from Google Image Search. For each color name we compute a significance distribution in CIELAB space whose maximum indicates the location of the color name in CIELAB. A first analysis discusses the quality of the estimations in the context of human language. Further, we conduct an advanced analysis supporting our choice to use a statistical method. Finally, we demonstrate that a color name mainly depends on the chromatic values and varies more along the lightness axis.
Proc. IS&T/SID 20th Color and Imaging Conference (CIC)
2012
IS&T/SID 20th Color and Imaging Conference (CIC), Los Angeles, California, USA, November 12 – 16, 2012.p. 30-35
Visit the COLOR THESAURUS web page.
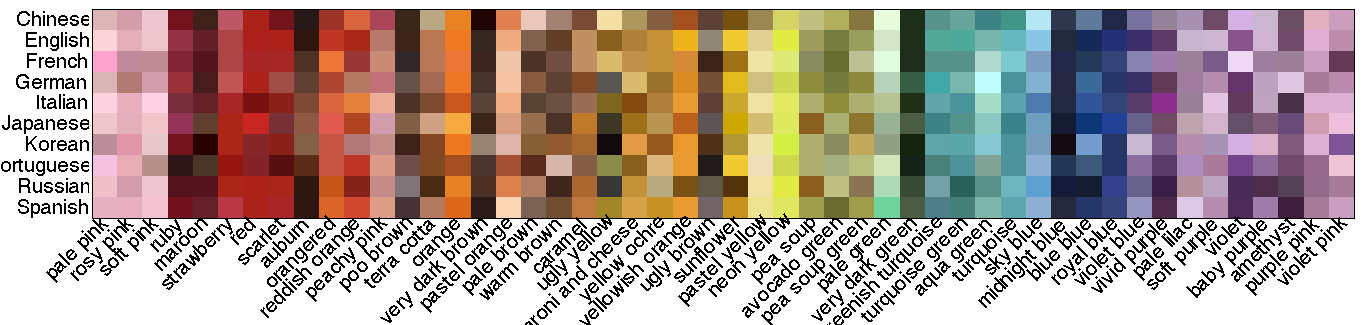
Example color estimations
Data acquisition
We used the 950 English color names derived in the XKCD study and translated them to nine other languages, which are Chinese, French, German, Italian, Japanese, Korean, Portuguese, Russian, and Spanish, respectively. all translations were done by native speakers with good command of English.
Using Google Image Search we acquired for each color name in each language the first one hundred images from the search result. The search query was the “color name” in quotes plus the word color in the respective language. Two example queries are “cloudy blue”+color and “bleu nuageux”+couleur for English and French, respectively.
Statistical analysis
We carry out a statistical test that assesses for each color bin whether images associated with a specific color name are likely to have a significantly higher (lower) bin count. This is reflected by a positive (negative) standardized significance value as shown in the figure below.
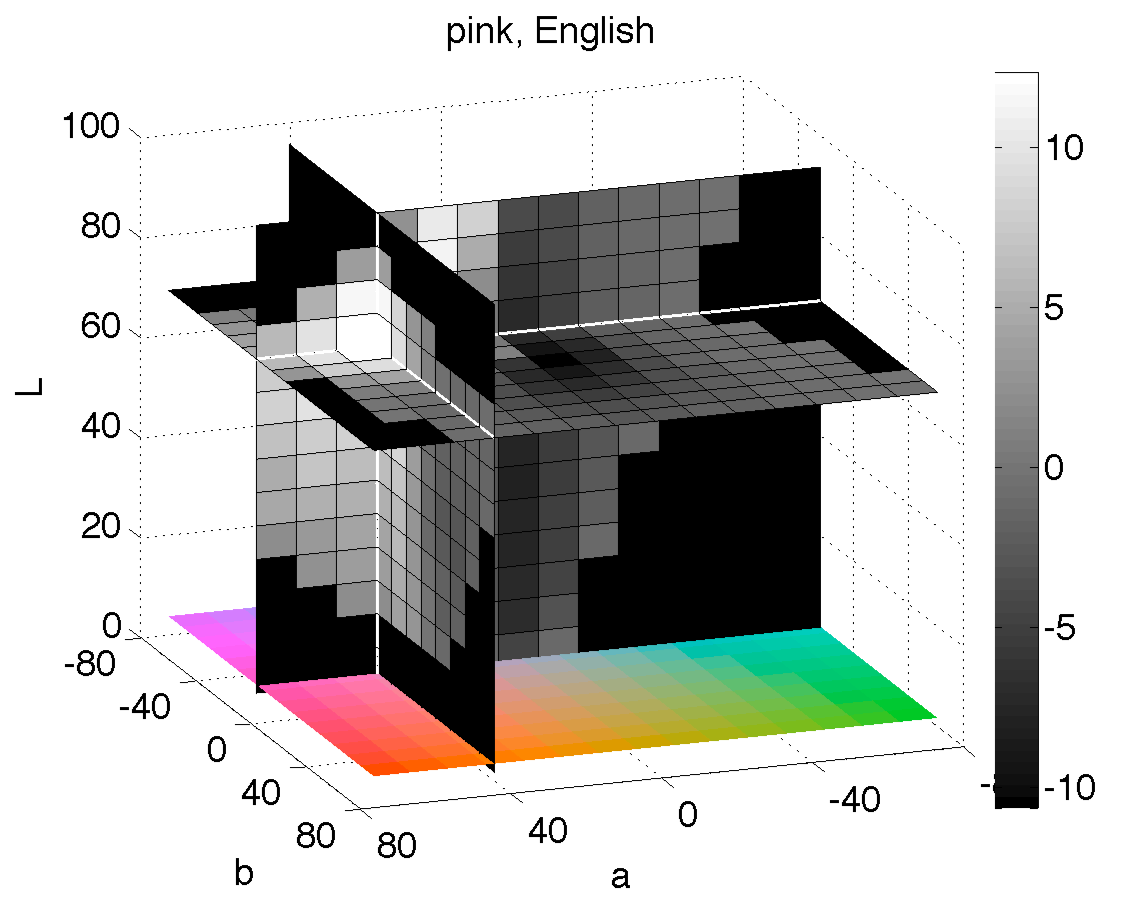
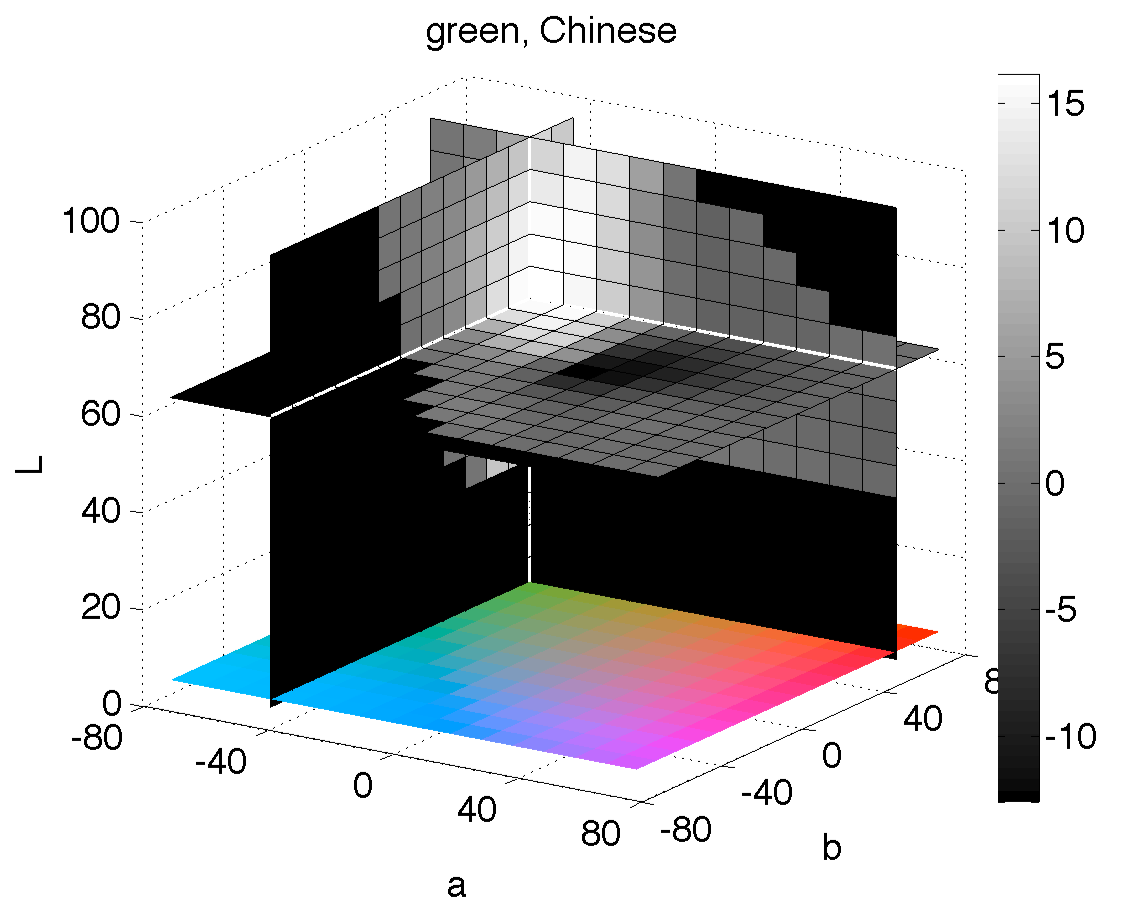
The above Figures show the z value distributions for two color names (pink, English and green, Chinese) in a 3-dimensional heat map. The maximum is located at the crossing of the three orthogonal planes. The homogeneous dark areas at the plane borders are out-of-gamut values. At the bottom, we show the histogram bin colors for the constant L plane through the maximum value for a better orientation in CIELAB space.
Download
Download the source code package (100 MByte).
Download the estimated results as a csv file (200 kByte).
Please contact the author for any questions.

This work is licensed under a Creative Commons Attribution-NonCommercial-ShareAlike 3.0 Unported License.